Data Bumpkin Launches Website
This is a short note to say: hello! First blog post! How exciting. This site is where I want to publish thoughts about the things I'm learning, show off some of the projects I'm working on, and open myself up for feedback from those that want to glance at this website.
As of today, I've completed Andrew Ng's Machine Learning online course through Coursera. I found the math really fun - my favourite courses in university were differential equations and linear algebra, so the mathematical concepts like computing gradients, Hessians, and vectorizing the code were right up my alley. I also liked the stretch of challenge that programming in Octave gave me, since it's been a significant amount of time since I've downloaded and installed the dreaded MATLAB environment.
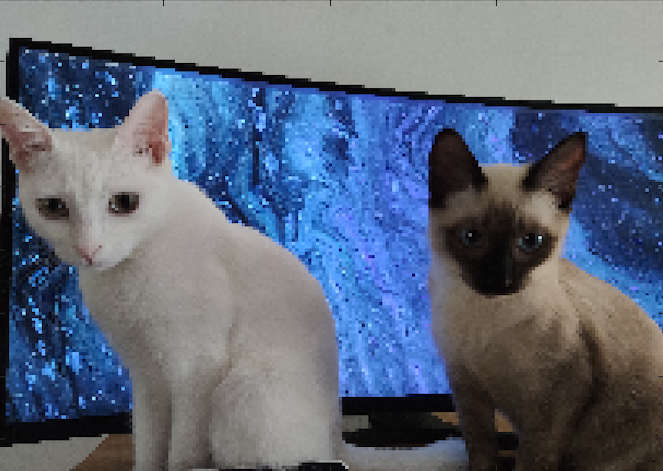
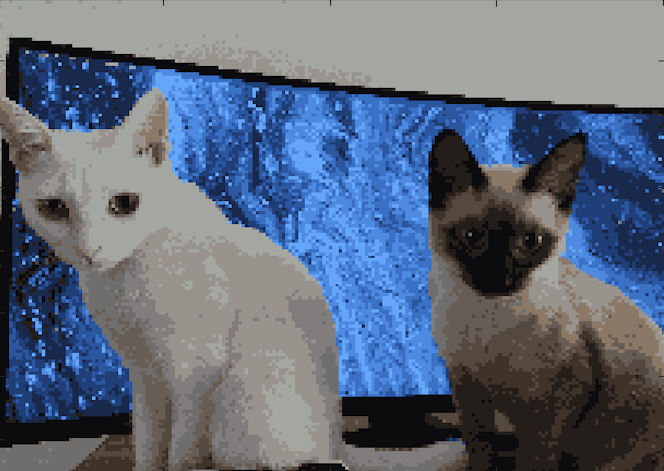
Below, you can see one of the projects I completed: taking a cell phone image of my cats (original size of 3000x4000 px), scaling it to 150x200 px, and then running the k-means algorithm to compress the image using only 16 colours! Flat cats!
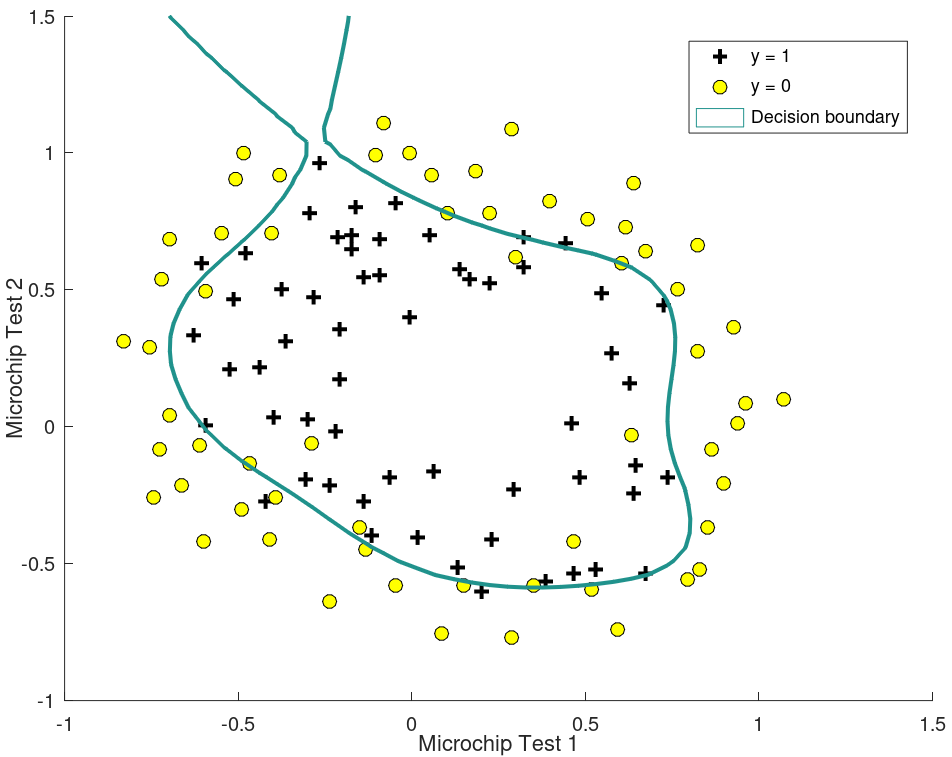
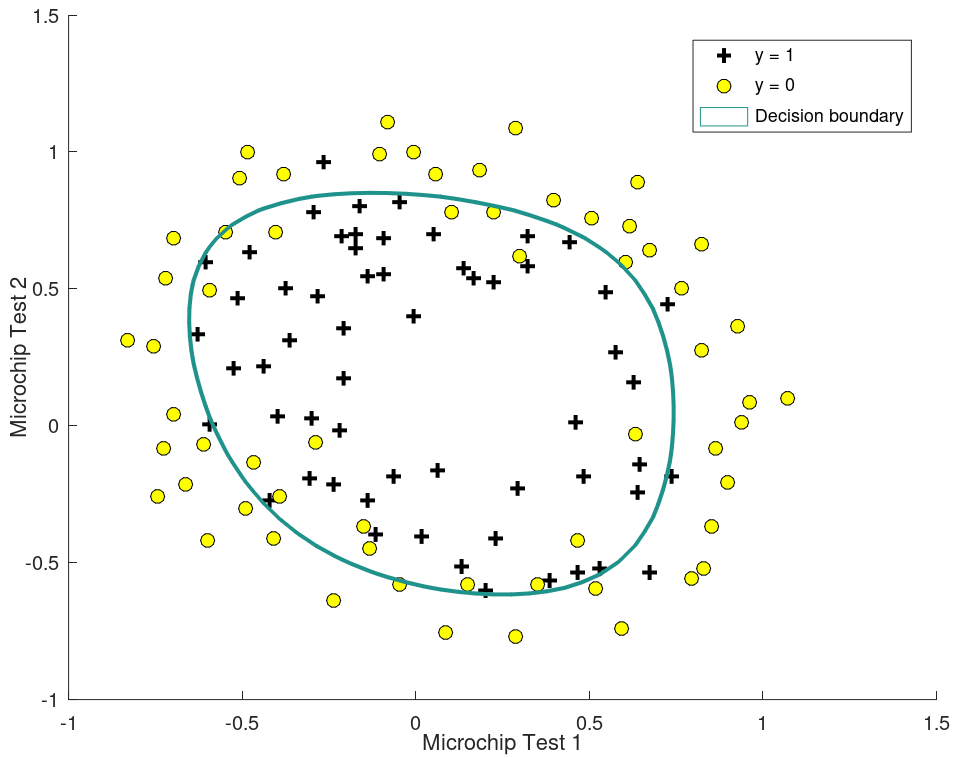
In another project, we used a linear regression model with non-linear features, which allowed us to move from a linear-decision boundary to a more complicated one. You can see how the decision boundary changed as we varied our regularization parameter (the part of your model that attemps to stop over-correcting - but as you can see, if it's too high, your model will have high bias, and low variance).
For the following images, lambda varies from 0, 1, 10, to 100 starting from top left, moving clockwise:
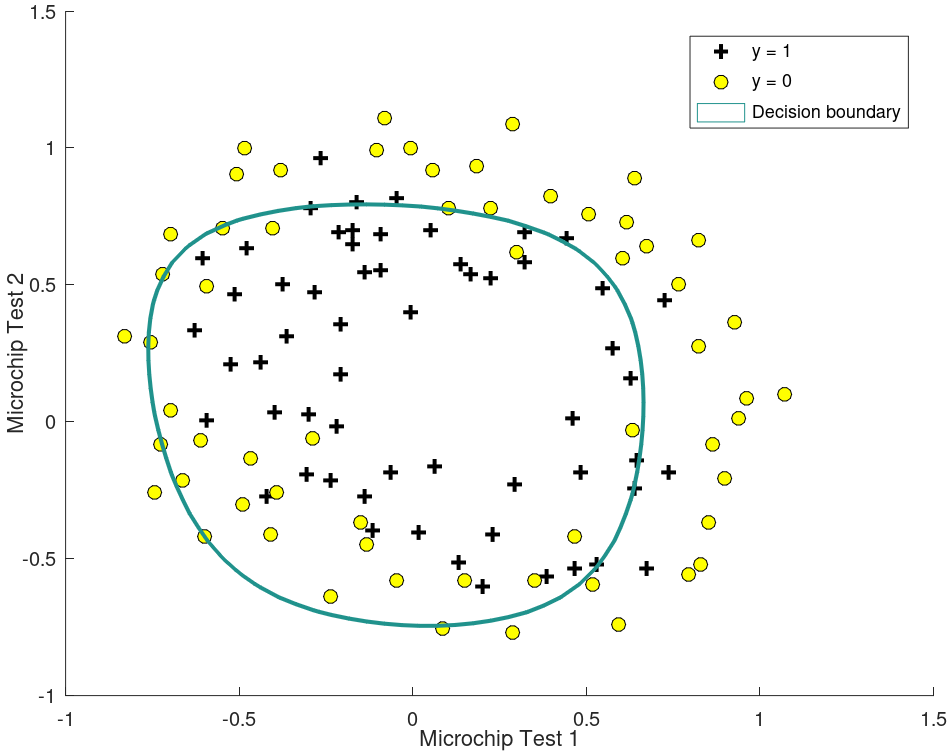
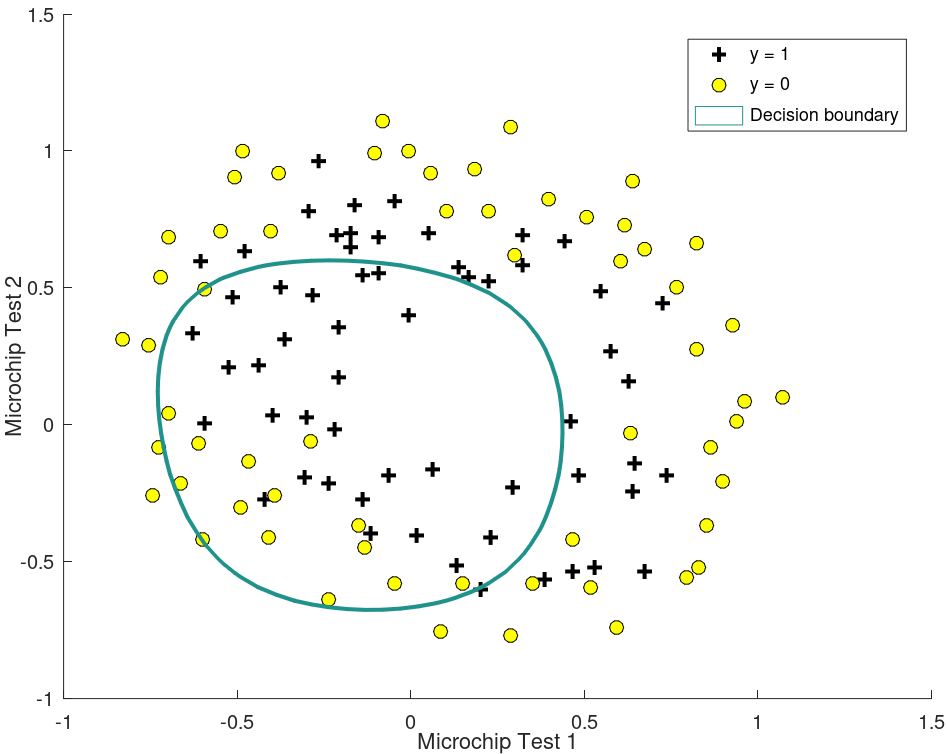
(Please forgive the lack of captions - I'm working on Jekyll + HTML5 integration. For my next post!)
For my upcoming projects, I want to translate the code I wrote for that class into python 3 to get familiar with python's packages, but change the actual code it operates on to other interesting datasets on Kaggle. I'll keep working though Berger and Casella's Statistical Inference, and continue using Rafael A Irizarry's Introduction to Data Science for a solid introduction to data visualization, and using ggplot2 in R.
That's all for now, thanks for reading!